Global Land Temperature by Country
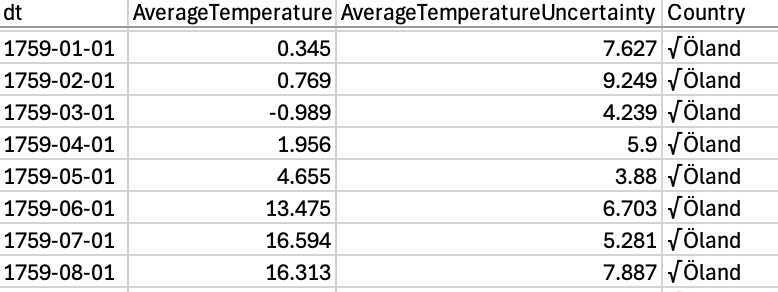
Our dataset (Global Land Temperature by Country) has over 577,000 data points, each including the date, temperature (in degrees celsius), 95% confidence interval around the average, and country in which the data was measured. The data includes measurements from 1743 to 2013 but some temperature values are missing in the earliest years. In most cases the country value is actually a country, but there are some data points that have a more general location such as “Antarctica.”
The organization that is in charge of the raw data is Berkeley Earth. Berkeley Earth is a non profit organization that is funded mainly by educational grants given by the US Government. In 2013, Berkeley Earth received approximately $1.3 million in unrestricted educational grants. Some other forms of funding for Berkeley Earth are individual donors such as the Charles G. Koch Foundation, the William K. Bowes Jr. Foundation, the Fund for Innovative Climate and Energy Research (FICER), and Lawrence Berkeley National Laboratory. Berkeley Earth donors have no say in what data is collected or how the data is collected. Berkeley Earth data has been cited in many major national articles and is seen as a respected source because its funding is separate from its research and data.
According to the creators of the dataset, the “early data was collected by technicians using mercury data.” The original sources of this information are from the Berkeley Earth Surface Temperature Study, which includes 16 pre-existing archives comprised of 1.6 billion temperature reports. The creators of the dataset, Global Land Temperatures by Country, have repackaged the data from the Berkeley Earth Surface Temperature Study into a more accessible composition allowing for easy navigation of information.
The dataset includes hundreds of years of our planet’s surface temperature history, illuminating information about climate trends since 1743. In general, the data should be able to show the rise of global temperatures since the beginning of the industrial revolution in the 1700s. It will also be able to show us the rate at which the temperature has been rising. It is possible for us to see phenomena such as the Environmental Kuznets Curve or, on the other hand, a pattern contradicting the Environmental Kuznets Curve such as a constant or even exponential increase of global surface temperatures. If the data from polar regions shows rising temperatures, it would reveal the melting of glaciers and in turn, rising sea levels.
Our dataset cannot reveal trends in less populated areas, since only certain countries in the dataset are tracked. It also does not contain information about natural disasters such as hurricanes and droughts that might be affected by rising land temperatures, nor does it contain information about glacial melting and rising sea levels. Since the dataset begins in 1743 and ends in 2013, it cannot reveal any information about average land temperatures from outside that range of dates.
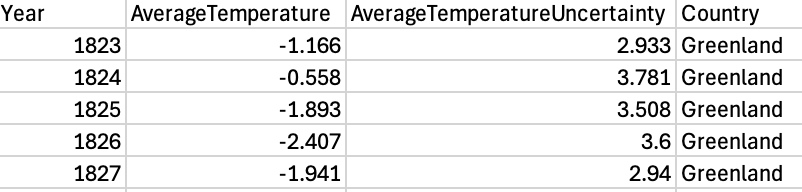
Our dataset provides a variety of temperatures, dates, and countries. Our spreadsheet will focus on Greenland and narrow down this data to the year, country, AverageTemperature, and AverageTemperatureUncertainty. This means we’re excluding other potential variables, since we do not need to analyze every type of temperature the dataset provides. This means we are excluding parts of the full Berkeley Earth dataset that are filtered by city because we are more interested in temperature changes on a larger scale.
Since our data is divided by country, it reinforces the idea of nation-states as the primary unit of analysis, potentially overlooking cross-border environmental issues or regional climate patterns. If it were our only source, we’d be missing information such as temperature changes in disputed territories or areas not recognized as countries. We would also lack any data on the impacts of rising sea levels.
Potential Impacts of Sea Level Rise
Our second dataset (Potential Impacts of Sea Level Rise) includes data predicting the impacts of future sea level rise for 84 coastal countries. The data was generated by the World Bank Group in 2006 with Geographic Information System (GIS) software. They used the software to compare the best available spatial global data on “critical impact elements” including land, population, agriculture, urban extent, wetlands, and GDP. The World Bank Group’s research was funded by the Canadian Trust Fund sponsored by the Canadian International Development Agency (CIDA). The data shows the projected impacts for each of these elements based on 1 to 5 meters of future sea level rise, respectively.
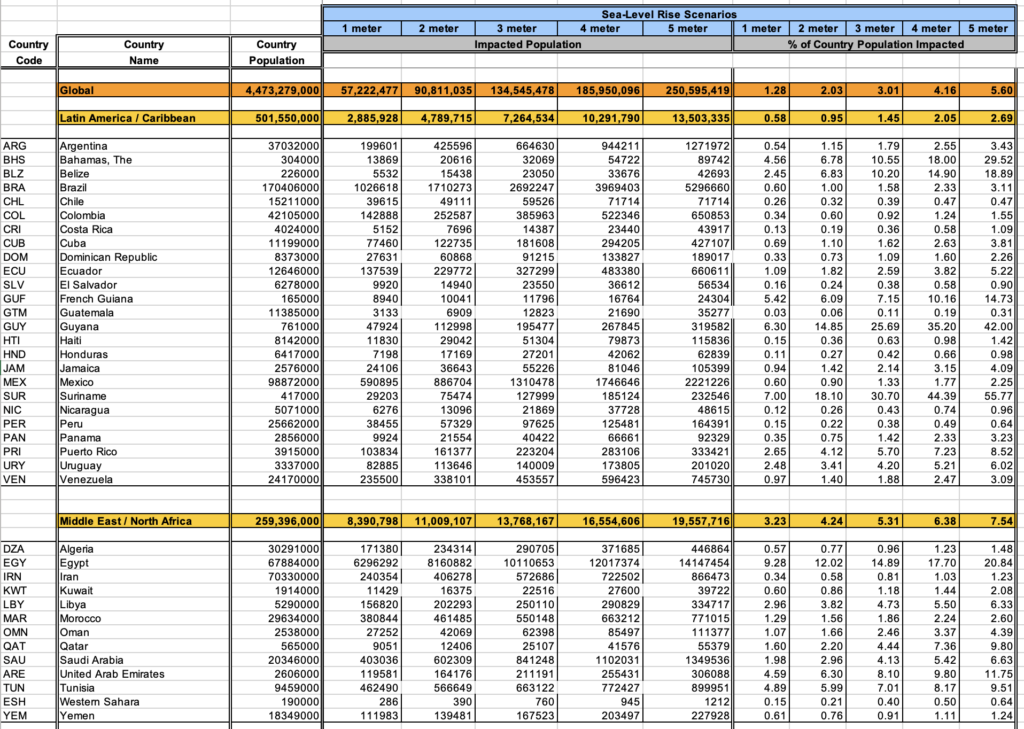
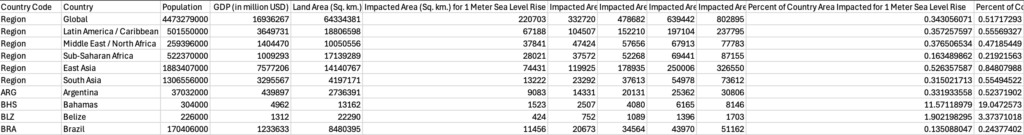
In its entirety, the dataset includes a three letter country code, the country, and separate tables with statistics for each of the aforementioned elements. Each element includes statistics on the total of the country’s element as well as data on the amount and percentage of the category impacted by sea level rise. Each element includes five data points for each subcategory, one for each level of sea level rise between 1 and 5 meters. The variables are:
- Country Code
- Country
- Population
- GDP (in million USD)
- Land Area (Sq. km.)
- Agricultural Land Area (Sq. km.)
- Urban Land Area (Sq. km.)
- Wetland Land Area (Sq. km.)
- Impacted Area (Sq. km.) for 1 to 5 Meter Sea Level Rise
- Percent of Country Area Impacted for 1 to 5 Meter Sea Level Rise
- Impacted Population for 1 to 5 Meter Sea Level Rise
- Percent of Country Population Impacted for 1 to 5 Meter Sea Level Rise
- Impacted GDP (in million USD) for 1 to 5 Meter Sea Level Rise
- Percent of GDP Impacted for 1 to 5 Meter Sea Level Rise
- Impacted Agricultural Land (Sq. km.) for 1 to 5 Meter Sea Level Rise
- Percent of Agricultural Land Impacted for 1 to 5 Meter Sea Level Rise
- Impacted Urban Land (Sq. km.) for 1 to 5 Meter Sea Level Rise
- Percent of Urban Land Impacted for 1 to 5 Meter Sea Level Rise
- Impacted Wetland Area (Sq. km.) for 1 to 5 Meter Sea Level Rise
- Percent of Wetland Area Impacted for 1 to 5 Meter Sea Level Rise
This dataset is predictive, meaning it can illustrate the negative effects of sea level rise across the globe if the trajectory of melting ice caps remains unchanged. Specifically, this dataset is useful for examining which groups are the most affected by sea level rise. Also, it allows us to see how different groups of people are affected in different ways. However, the data does not include impacts from the past so we are unable to use the data to analyze how these groups have already been affected by rising sea levels. The data also lacks specific locations within the countries so we are unable to see which parts of each country will be heavily impacted.
Our spreadsheet excludes the elements of agriculture, urban extent, and wetlands because we are more interested in investigating the effects of sea level rise on populations and their land and economies (GDP).
Our full data cleaning process for both datasets is detailed on the About page.
Citations
Both the data itself and information about the data was sourced from the following resources:
Berkeley Earth. “Climate Change: Earth Surface Temperature Data.” Kaggle, Berkeley Earth, 1 May 2017, www.kaggle.com/datasets/berkeleyearth/climate-change-earth-surface-temperature-data/data?select=GlobalLandTemperaturesByCountry.csv.
World Bank Group. “World Sea-Level Rise Dataset.” World Bank Group Data Catalog, Canadian International Development Agency (CIDA), 4 June 2019, datacatalog.worldbank.org/search/dataset/0041449/World-Sea-Level-Rise-Dataset.